
The most common question we’re being asked these days is "how is COVID-19 affecting the housing market?"
We’re talking to plenty of sellers who don’t want to list their homes right now because they don’t think anyone is out there buying, and we’re talking to plenty of buyers who are waiting to purchase because they feel a housing market crash is coming.
While we can’t see the future, we can use data to talk about what’s currently happening and how that might dictate the market. With April coming to an end, we now have our first full month of statistics while the city is in lockdown.
Disclaimer - April data is just the beginning, as many of the sales in April likely went under agreement prior to the city shut down. On average, sales take roughly 45 days to close, so we’ll send out another email at the end of May as a part 2 to this to paint the full picture.
To begin, let’s compare this year to last year.
2020 vs. 2019

One indicator we can track day-by-day is the number of active listings currently for sale on the market. This above graph reflects the number of condos for sale in Boston compared to last year. You'll notice that we started March on a similar path to last year, gearing up for a busy spring market. However, once we hit the middle of March, which was when the stock market crashed and the city began to put measures into place to slow the spread of COVID-19, housing inventory began to drop. This was a combination of two things; listed homes were temporarily withdrawn from the market as homeowners became hesitant to have strangers visiting their homes (rightfully so), and sellers ready to list their homes for the spring market were holding off and waiting to see how this plays out.
Today, Boston’s active condo inventory is 13.4% lower than it was at the end of April 2019. We’re analyzing Boston’s active condo inventory because it provides the largest and most informative sample size. The combined Cambridge, Somerville, and Brookline active condo market is just 20% of the size of the Boston’s. Below are graphs showing those condo markets.

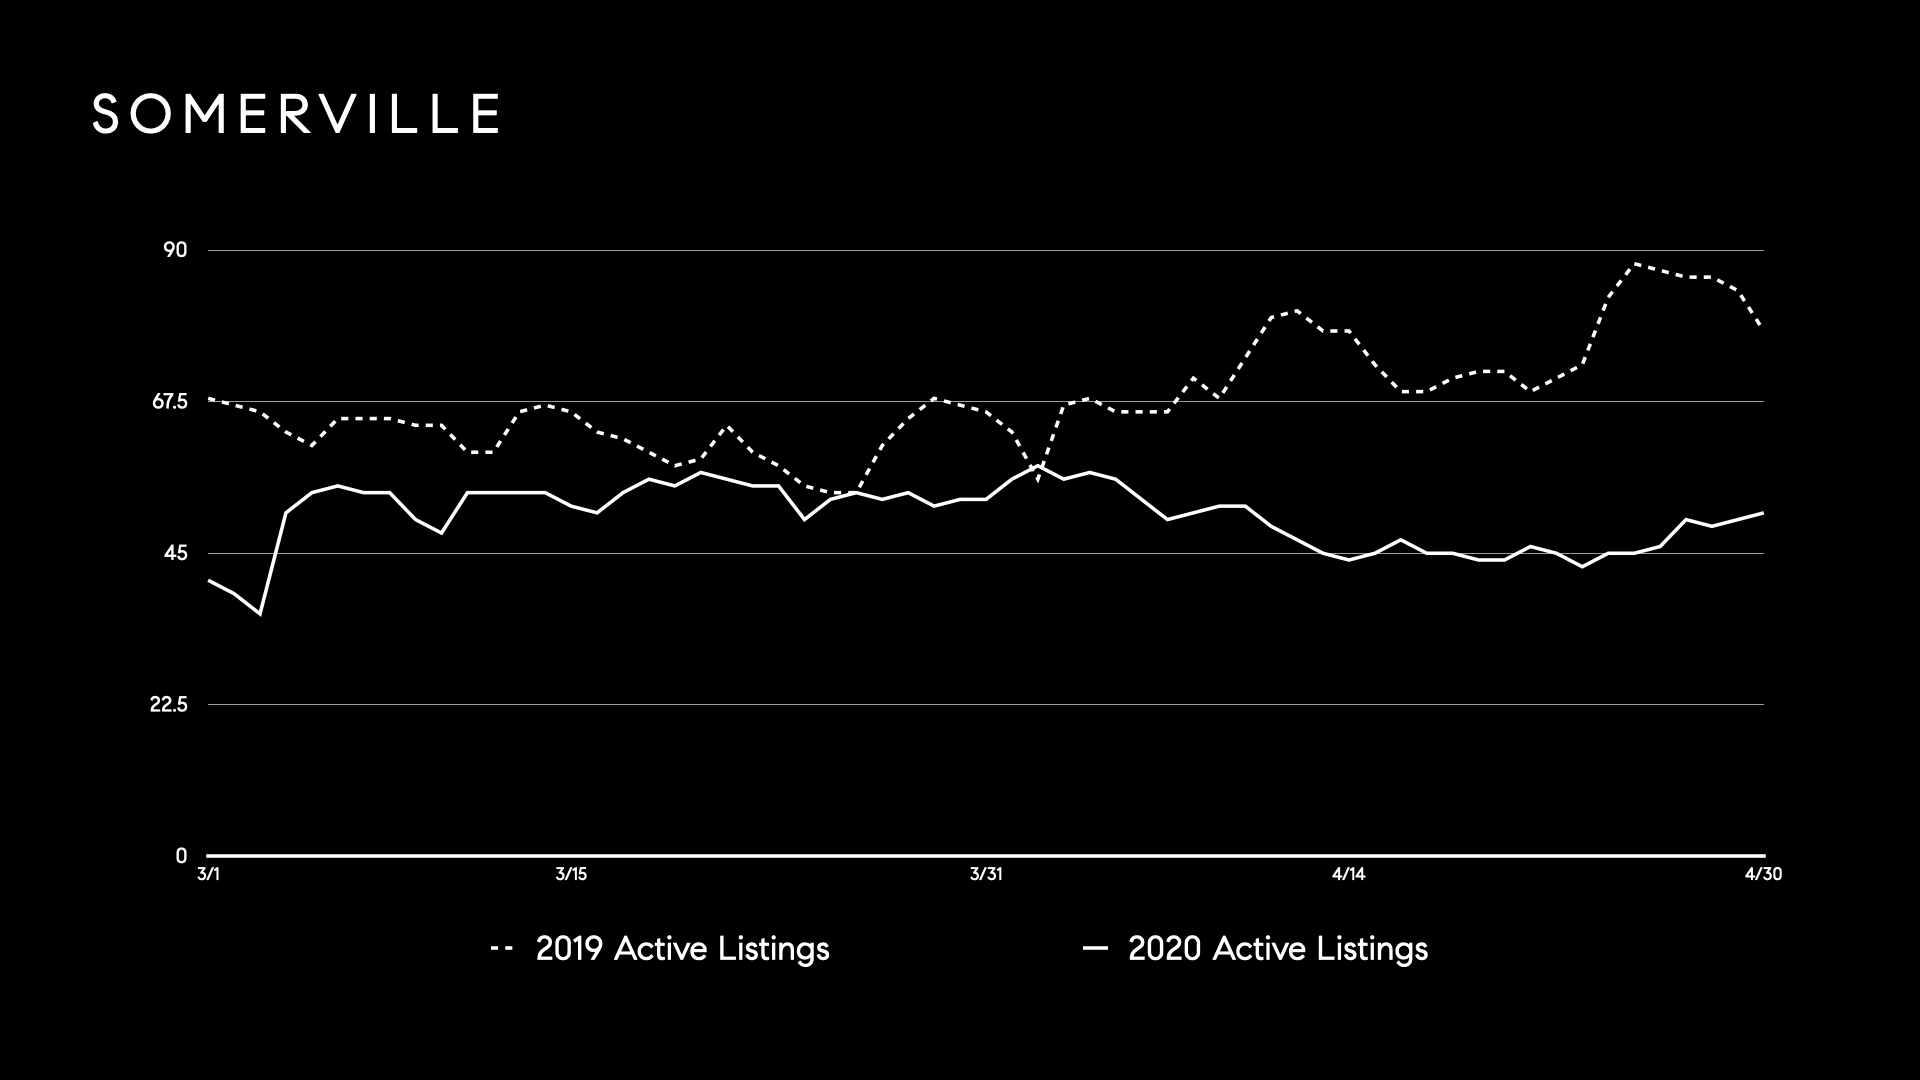

Overall, the trends are similar across the board. In the last week, we’ve noticed an uptick in new listings and activity, and we’re monitoring the market to see how things progress in May.
Another real-time indicator we can easily track is how long properties are sitting on the market. Using the Boston condo market as an example (graph below), you'll see that at the same time inventory began to drop, days on market (DOM) started to rise. The spring market is typically competitive and it’s common for homes to only last one weekend on the market. However, now that we've gone through a month of stay-at-home orders, those days on market numbers are rising and well above normal.

So, how has COVID-19 affected pricing?
This is where we’ll repeat that disclaimer again: homes can often take 45-60 days to close. May will be a better sample of that, but these statistics tell us where we are today.

This time, we’ll incorporate data on single family homes with the condominium data. In April, you’ll notice the median price of homes sold dropped 4.8% from March but remains 6.2% higher than it was in April of 2019. The number of total sales in Boston for April has dropped dramatically compared to where we were this time last year (17.5%), and we suspect that trend will continue through May.
Somerville had a similar trend to Boston, with April seeing a small 3% dip in median sale price from March, while still being well ahead of where we were this time last year, a whopping 16.3% increase. Somerville has also seen a drop in the number of total sales compared to last year.


Brookline is the one city that has seen both a median price increase from March to April (up 28.4%) and an increase between April '19 to April ‘20 (up 3.9%), while the number of listings sold has dropped (just 26 sold in all of April according to MLS records).
Cambridge is the only city that has seen a drop in pricing year over year, down 24.7%.
Each city continues to see a decrease in days to offer (DTO) on all homes sold. This is one statistic that we believe will change course when we can review statistics for May, as the days on market has been on the rise across the board.
IS THIS 2008/2009 AGAIN?
Many Bostonians who owned property during The Great Recession are nervous that we’re about to relive that housing market crash. And while there are economic similarities between now and then, a housing market crash is not one of them.
So how is today different from 2008? For starters, The Great Recession was an economic crash that was triggered by a housing market crash, not a housing market crash caused by a global crisis. The other reason is simple: supply & demand.
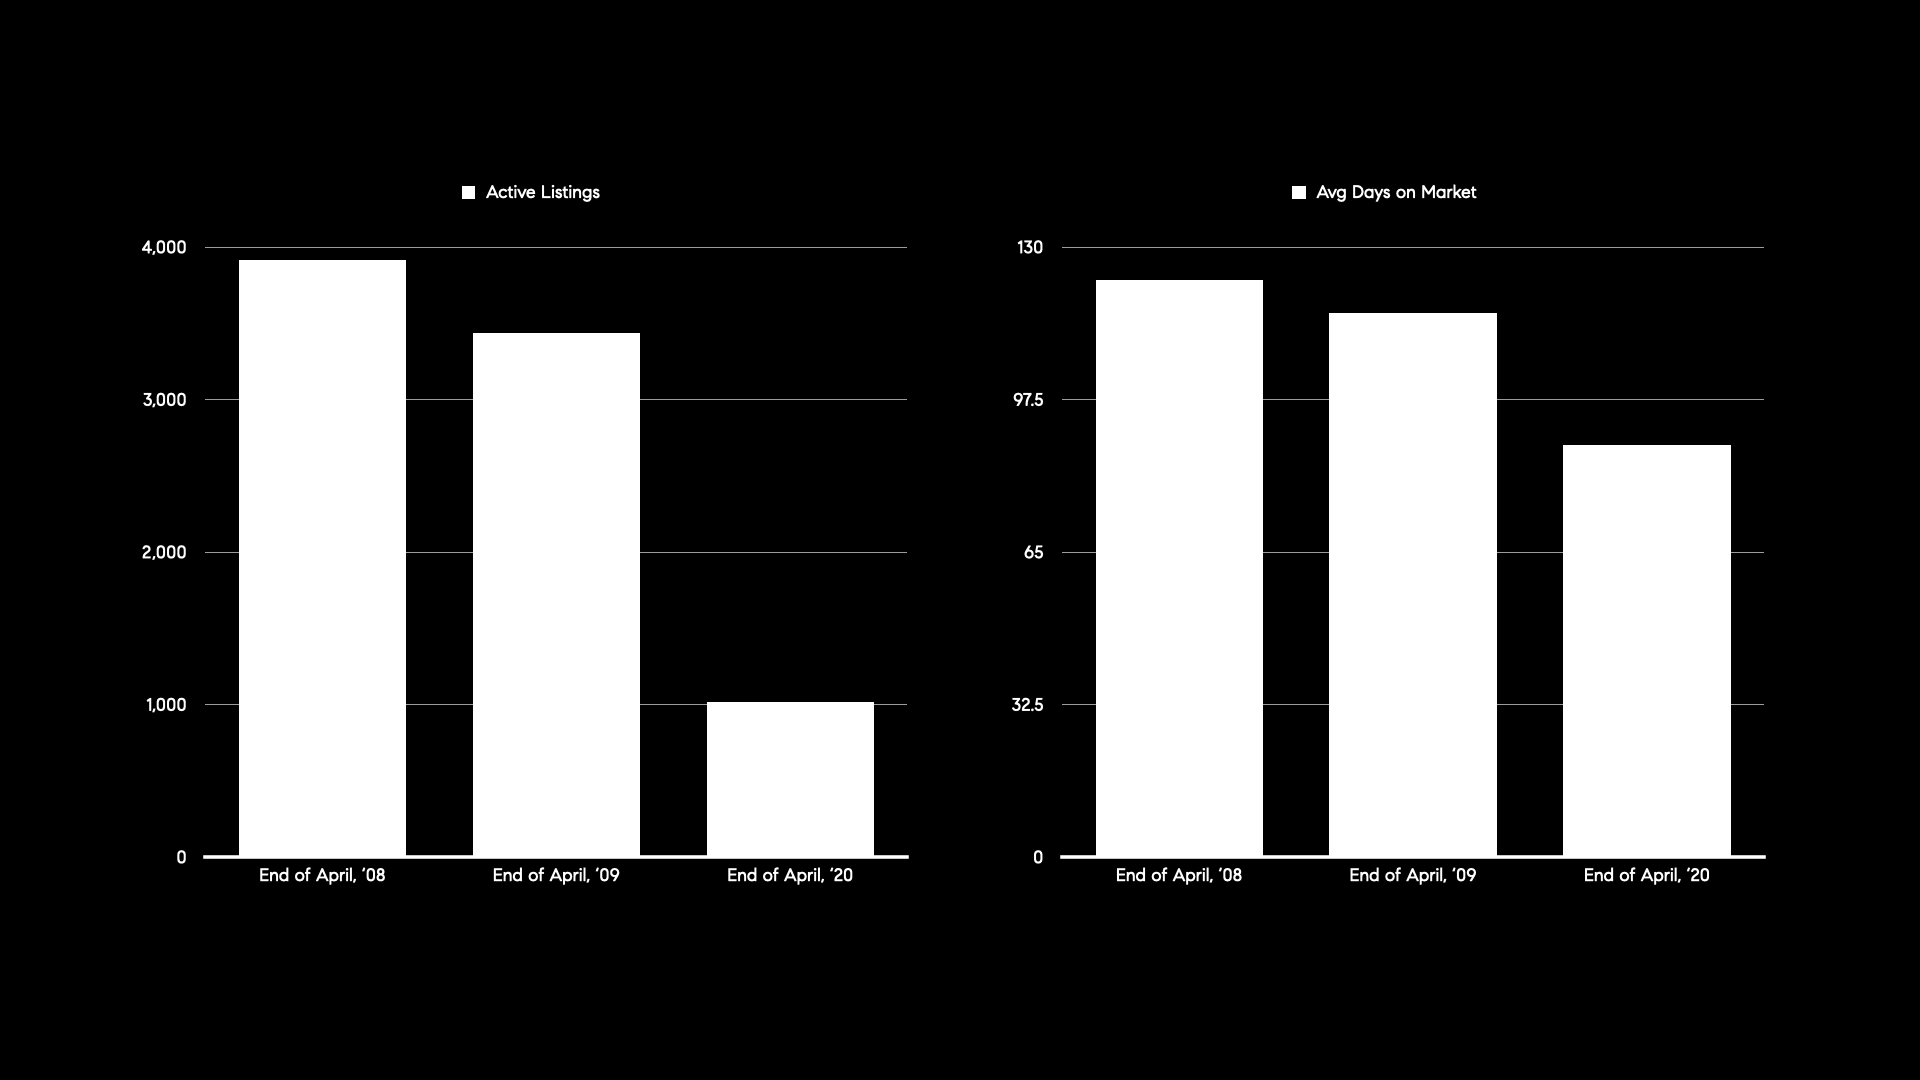

These two graphs show the Greater Boston housing market (Boston, Brookline, Cambridge, and Somerville) in April 2008, 2009, and 2020.
The number of active listings by the end of April 2008 was nearly 4 times the amount today, and the end of April 2009 had roughly 3.5 times the amount today. When you compare that to the number of sales closed for that same time frame, April '08 had a backlog of 7.5 months of inventory, April '09 had a backlog of 8.5 months of inventory and this April only has a backlog of 2.5 months of inventory (meaning, if after today there were no more new properties added to the market, going off of the current sell rate, we would be clean out of inventory in 2.5 months).
On top of that, homes for sale in April 2008 were closing at an average of 93% of their original asking price, which dropped down to 92% of the original asking price the following April. Today? On average, homes are closing at 100% of their original asking price!
SO WHAT DOES IT MEAN?
To summarize, the one thing that's going to protect our housing market from a crash is inventory. We started 2020 with a housing shortage, and as a result of COVID-19, we have an even higher housing shortage. While it doesn't make it easy to find the perfect home, it does assure us that Boston’s housing market is holding strong. It’s possible we’ll see fluctuations in days on market, as well as small dips in some neighborhoods or price points, but overall the data we have currently shows the Boston market will weather this storm, and changes are only temporary.
We'll be sure to update you all in a month to give you the second part of this story. In the meantime, if you have any questions about a specific market, don't hesitate to reach out!
- Sam, Mark, Catherine and Lauren